

Option strategy
- Analyse profit probability with payoff charts
- Add, remove, reorder columns
- Customise your option chain your way
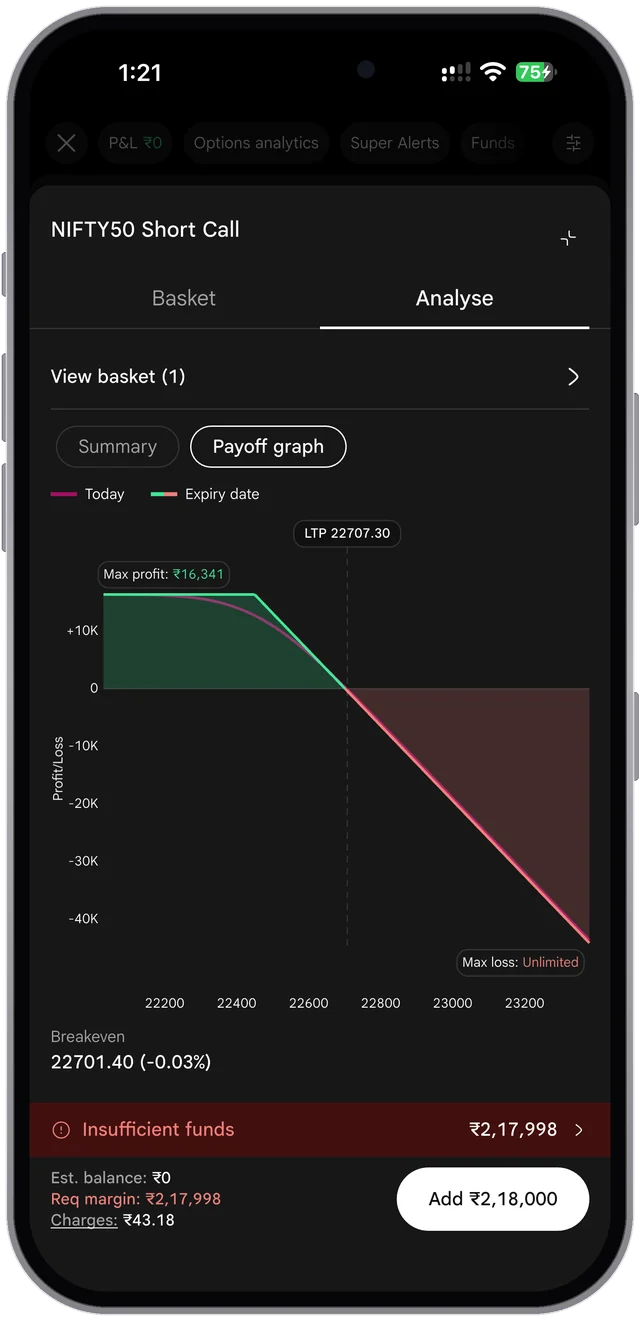
Professional execution, real-time intelligence, and advanced tools built for serious traders.

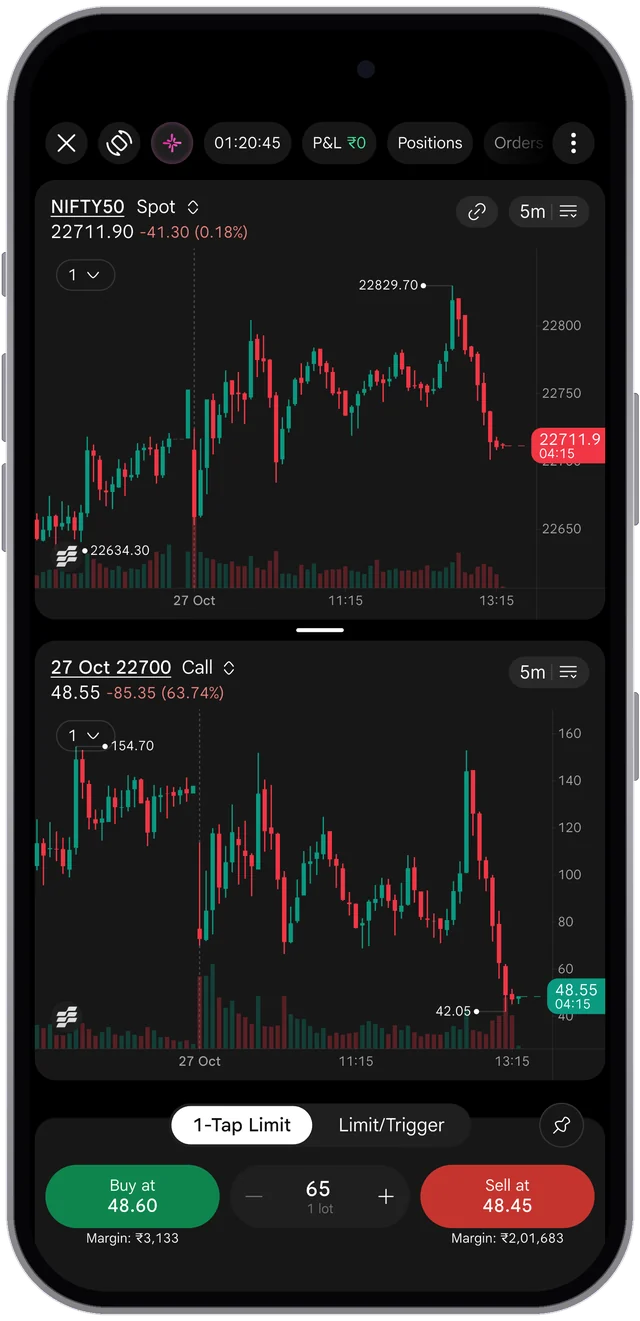
Chart, order pad, positions and live P&L sit on one screen. You read the move and place the trade in the same view, without switching tabs or losing the candle you were watching.
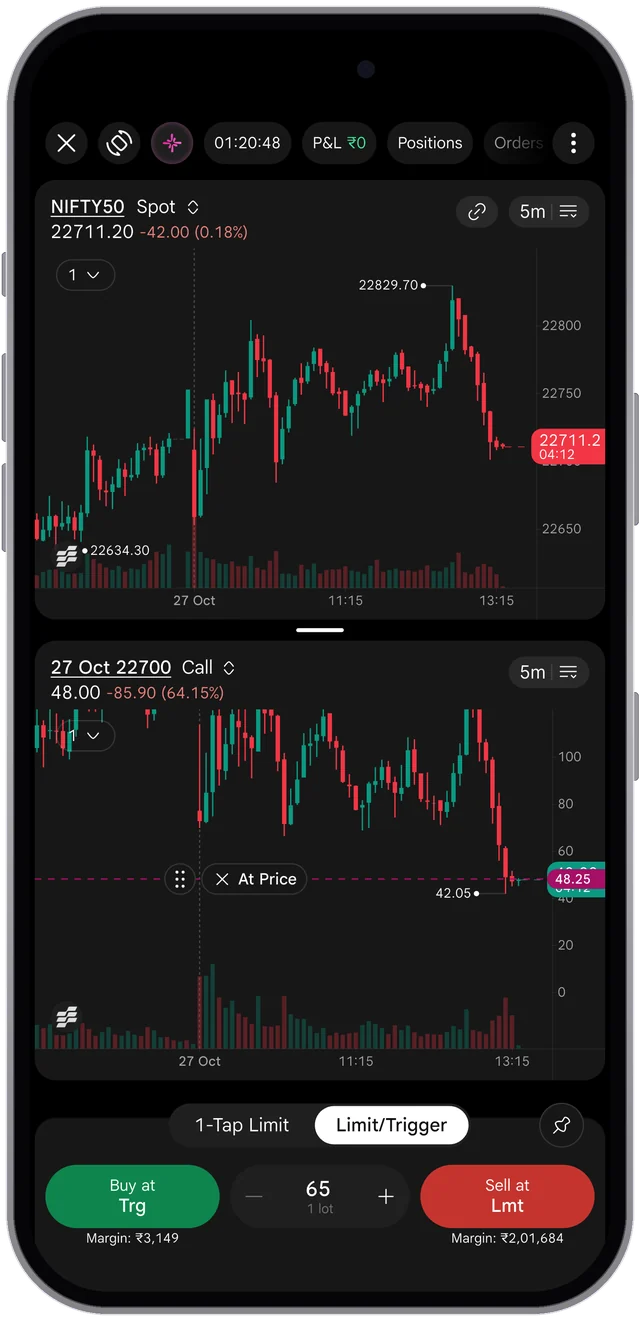
Choose market for an immediate fill or limit for your price. Both are 1-Tap from the chart, with quantity and product type already set to your saved defaults.

Place a stop loss and target by dragging them to the level you want on the chart. The price updates as you drag, so you set protection at a level you can see rather than a number you type on a separate order form.

See profit and loss for each individual trade, not just the day's total. When you have added to a position in stages, you know which entry is working and which is not.

Set a trailing level once and the stop loss moves up as the price rises, holding the gains you have made. It stays put when the price falls back, so your downside stays where you set it.
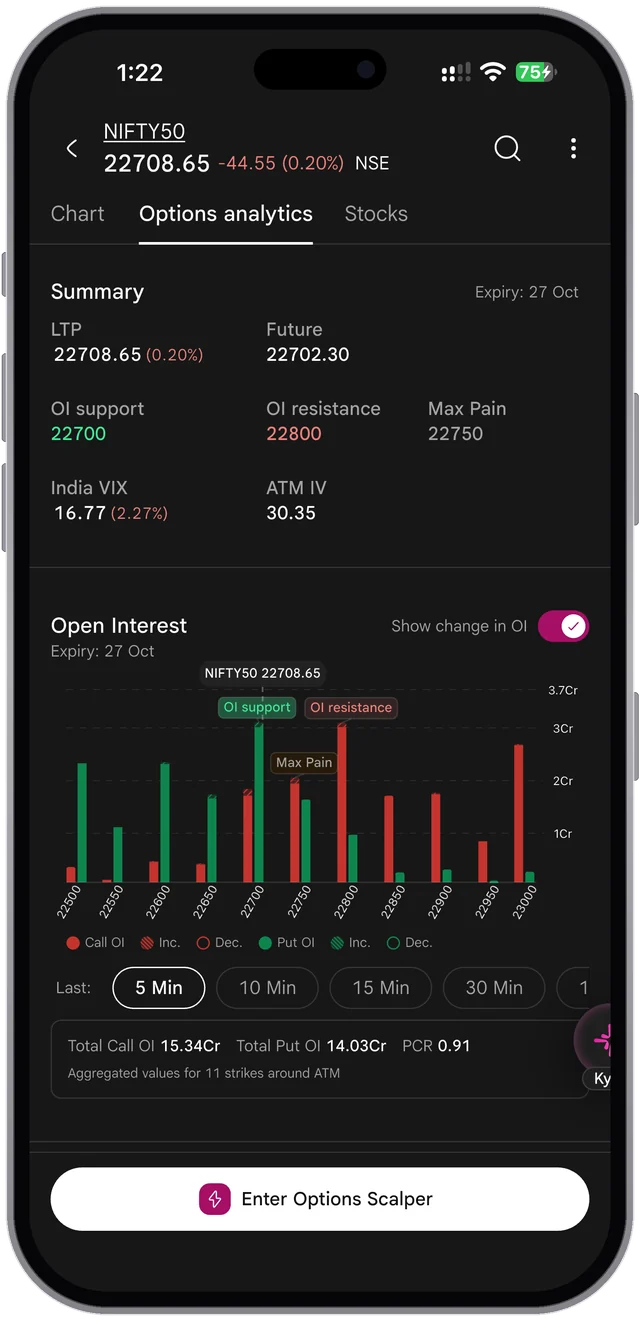

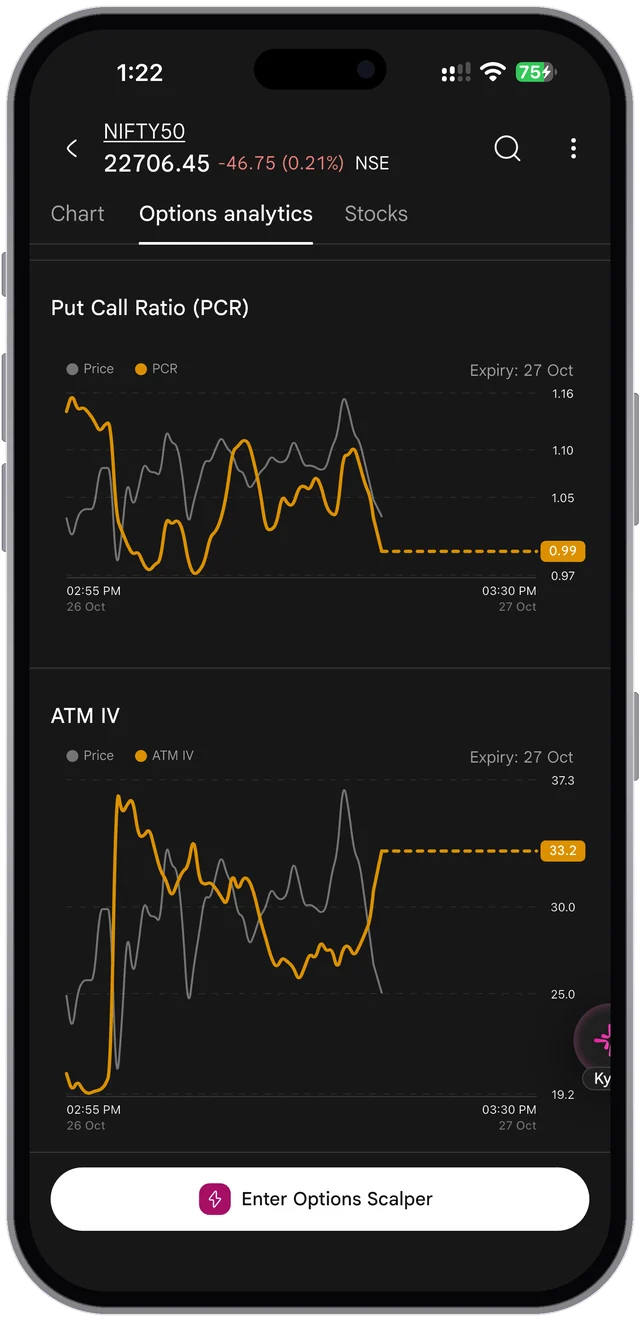
Where the positions are, which stocks are building them, where the chart takes you, and a home screen in the order you choose.
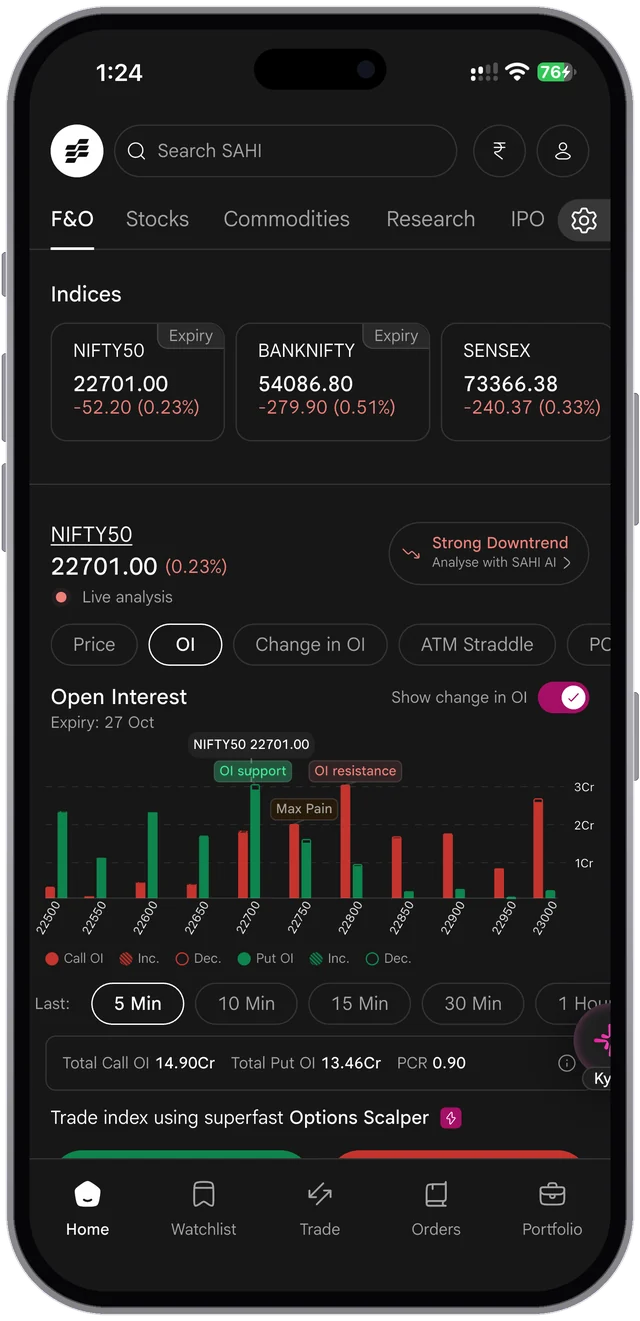
The indices open the F&O home, and the ones expiring today carry an Expiry tag, so a weekly expiry never takes you by surprise.

On the F&O home, with OI support, OI resistance and max pain marked, and the change in OI over the last 5 minutes to an hour.
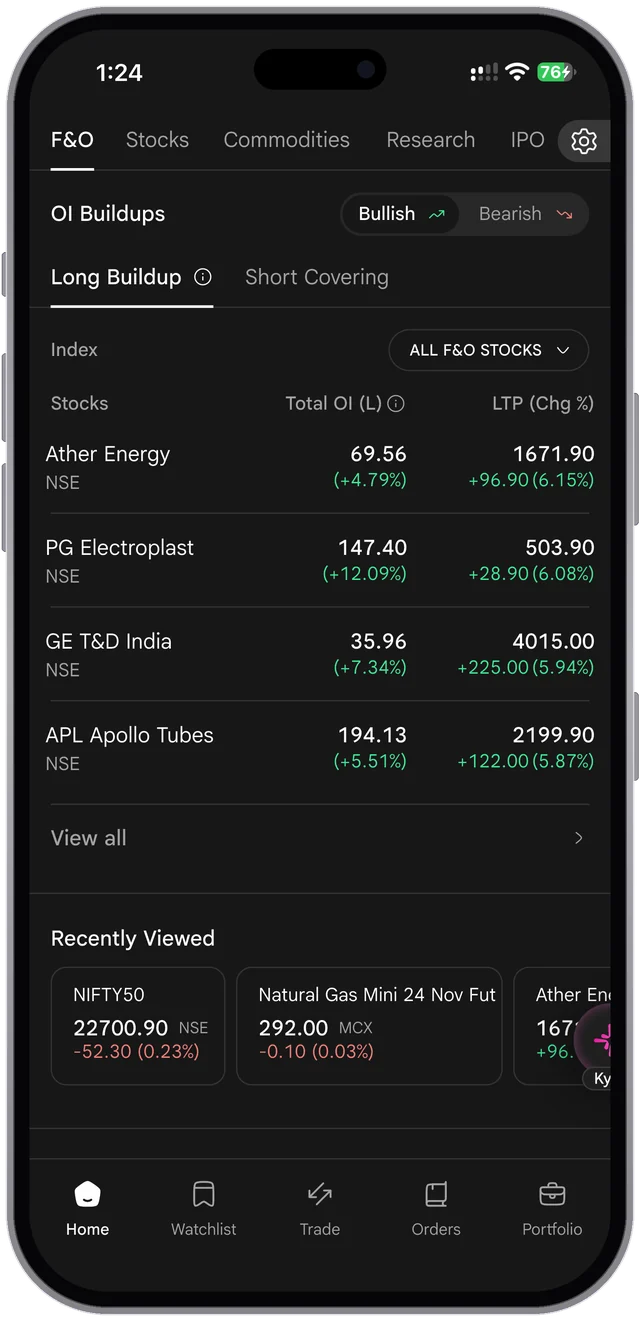
Which F&O stocks see long buildup or short covering, with a Bullish and Bearish switch, total OI in lakhs and the day’s move.
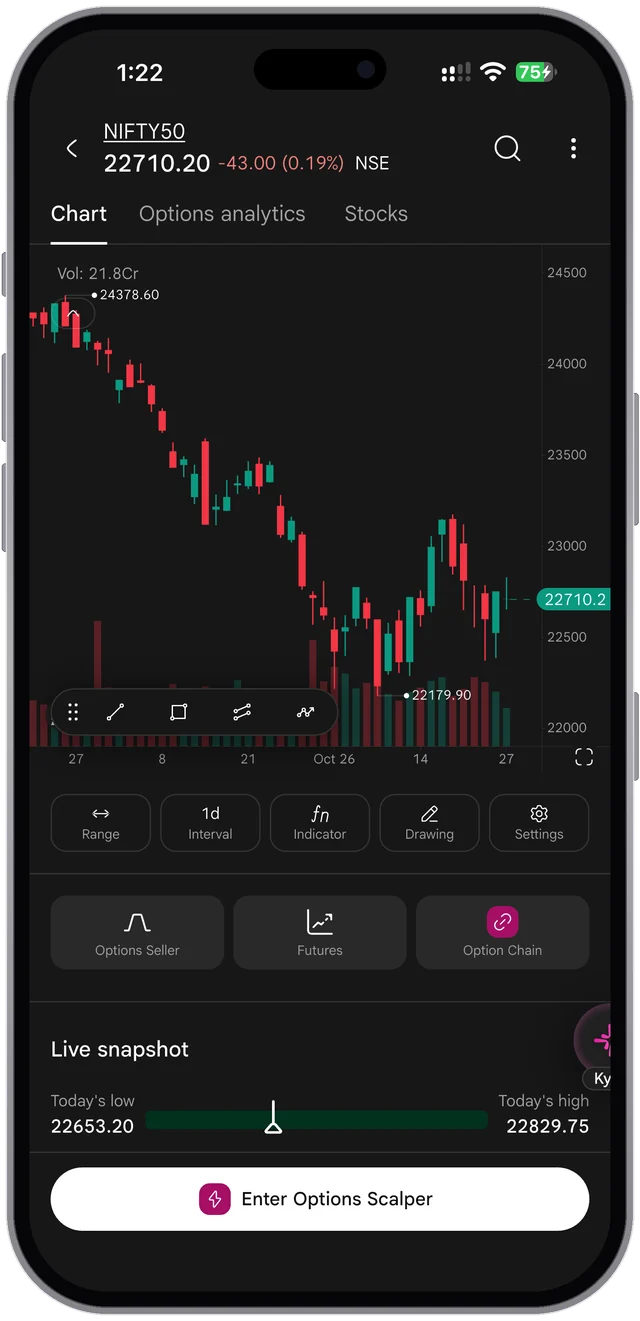
Options Seller, Futures and the Option Chain sit under every index chart, with today’s range in the live snapshot.
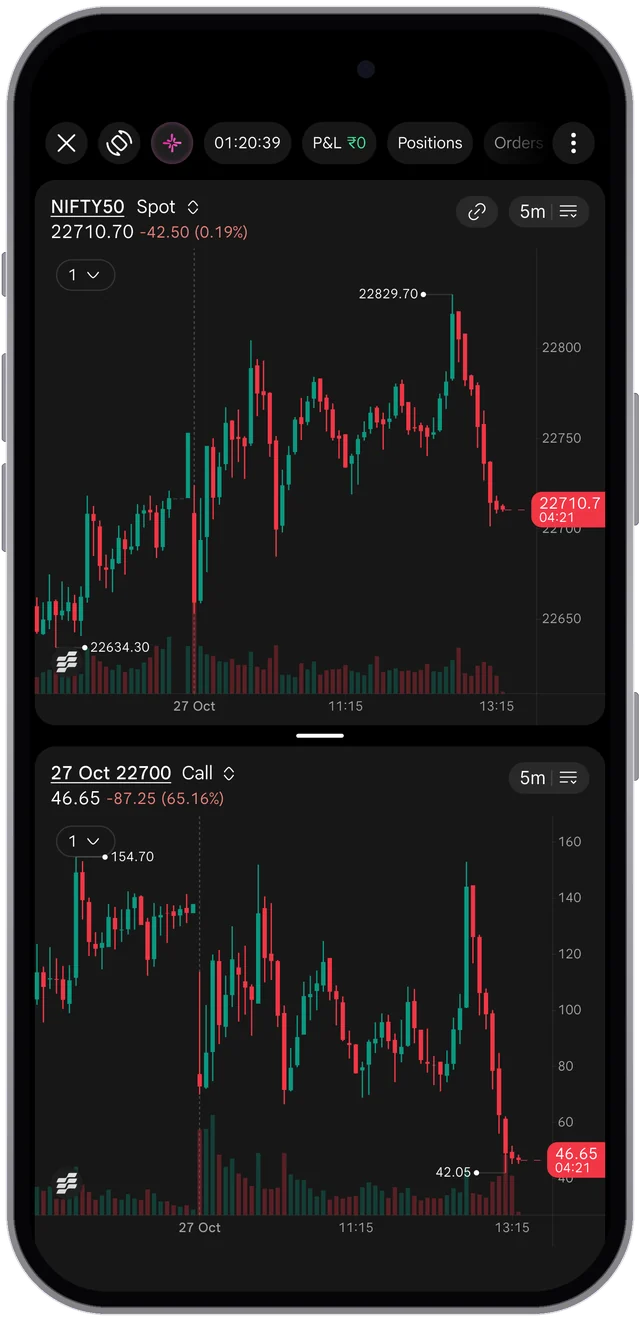
The index above the option, both on the same timeframe, with the order bar tucked away until you need it.

Customise Home lets you drop or reorder the widgets on each tab: indices, OI, scanners, the Scalper and more.
F&O, or Futures and Options trading, means buying or selling derivative contracts whose value is based on an underlying index or stock. A future is an agreement to buy or sell at a set price on a future date, while an option gives the right, not the obligation, to do so. Both are used to speculate or to hedge.
A futures contract obligates both parties to settle at expiry, so profit and loss move one-to-one with the underlying. An option gives the buyer a right without obligation in exchange for a premium, so the buyer can lose at most that premium. The seller collects the premium but takes on the obligation, and can lose far more than the premium received. Options let you shape risk, while futures give linear exposure.
You need enough for the margin on one lot. Buying an index option can cost a few thousand rupees in premium, while futures and option selling require much larger margin set by SPAN plus exposure. Start with capital you can afford to lose, because most retail F&O traders make net losses.
For most retail traders it is not. SEBI’s study of the 2021-22 to 2023-24 financial years found that 93% of individual F&O traders made losses. Profitability depends on a real edge, strict risk management and low costs. A flat, low per-order fee helps with costs, but low costs alone do not make trading profitable.
Costs include brokerage, STT, exchange transaction fees, SEBI fees, stamp duty and GST. SAHI charges a flat fee per executed order rather than a percentage, which keeps brokerage predictable. The statutory charges are the same at every broker: STT on the sell side, stamp duty on the buy side, and GST on brokerage and fees.
OI support is the strike with the most put Open Interest below the price: put writers there expect the index to stay above it. OI resistance is the strike with the most call Open Interest above the price, where call writers expect it to stay below. Max pain is the strike at which options buyers, taken together, would lose the most at expiry. SAHI marks all three on the Open Interest chart. They show where positions are, not where the price will go.
An option chain lists each strike with its price, Open Interest, and implied volatility. Rising OI shows where positions are building, the Put-Call Ratio (PCR) gauges sentiment, and IV shows the volatility priced in. SAHI shows live OI and OI change, PCR, IV, and ATM straddle data alongside the chain.
F&O is a regulated financial activity, not gambling, but it can be used recklessly. The difference is edge and risk management: hedging, position sizing, and stop losses make it a disciplined activity, while random directional bets resemble gambling. Traders without a plan are the ones who usually lose money.
Open a trading and demat account, complete KYC, and enable the F&O (derivatives) segment, which usually needs income proof such as a bank statement, salary slip, or ITR. Once approved, you can trade index and stock derivatives. SAHI lets you activate the F&O segment inside the app.
F&O profits are non-speculative business income, taxed at your slab rate and reported in ITR-3. A loss can be set off against other income except salary, and the rest carried forward for up to eight years against business income. A tax audit may apply above certain turnover limits. This is general information, not tax advice.
Pay only ₹10 per executed order and save 50% more than other platforms.
Account opening
AMC charges
Brokerage charges per order