

SAHI Scalper: Built for F&O Scalping
SAHI Scalper is a dedicated F&O scalping terminal built for Indian markets, with in-house charts and 1-Tap execution from a single screen.

How to use SAHI Scalper
-
Single screen:
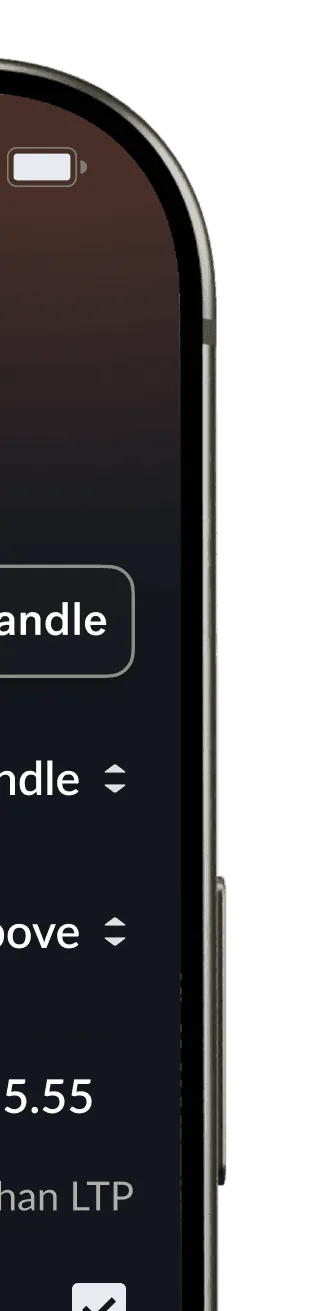
Index + call/put & option chainMonitor index movement, call/put activity, and the complete option chain together on a single screen. Stay aligned with market direction and execute trades without switching between multiple views.
-
Order defaults, pre-decided trade quantities
Save your preferred order settings and trade quantities for faster execution. Reduce repetitive inputs and place trades instantly with pre-configured defaults.
-
Chart settings:
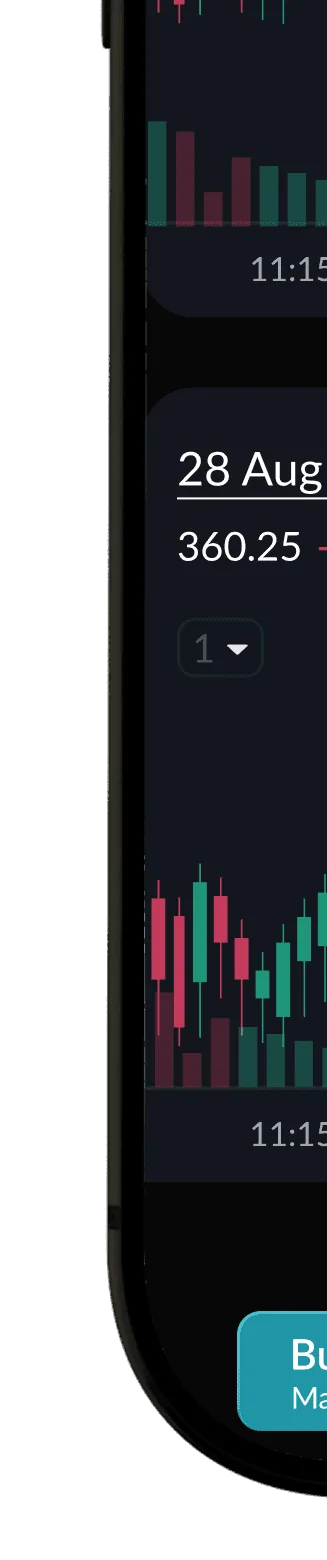
Indicators, drawings & configurationsCustomize charts with your preferred indicators, drawing tools, and trading setups. Build a personalized analysis workspace that matches your strategy and workflow.
-
1-Tap order execution
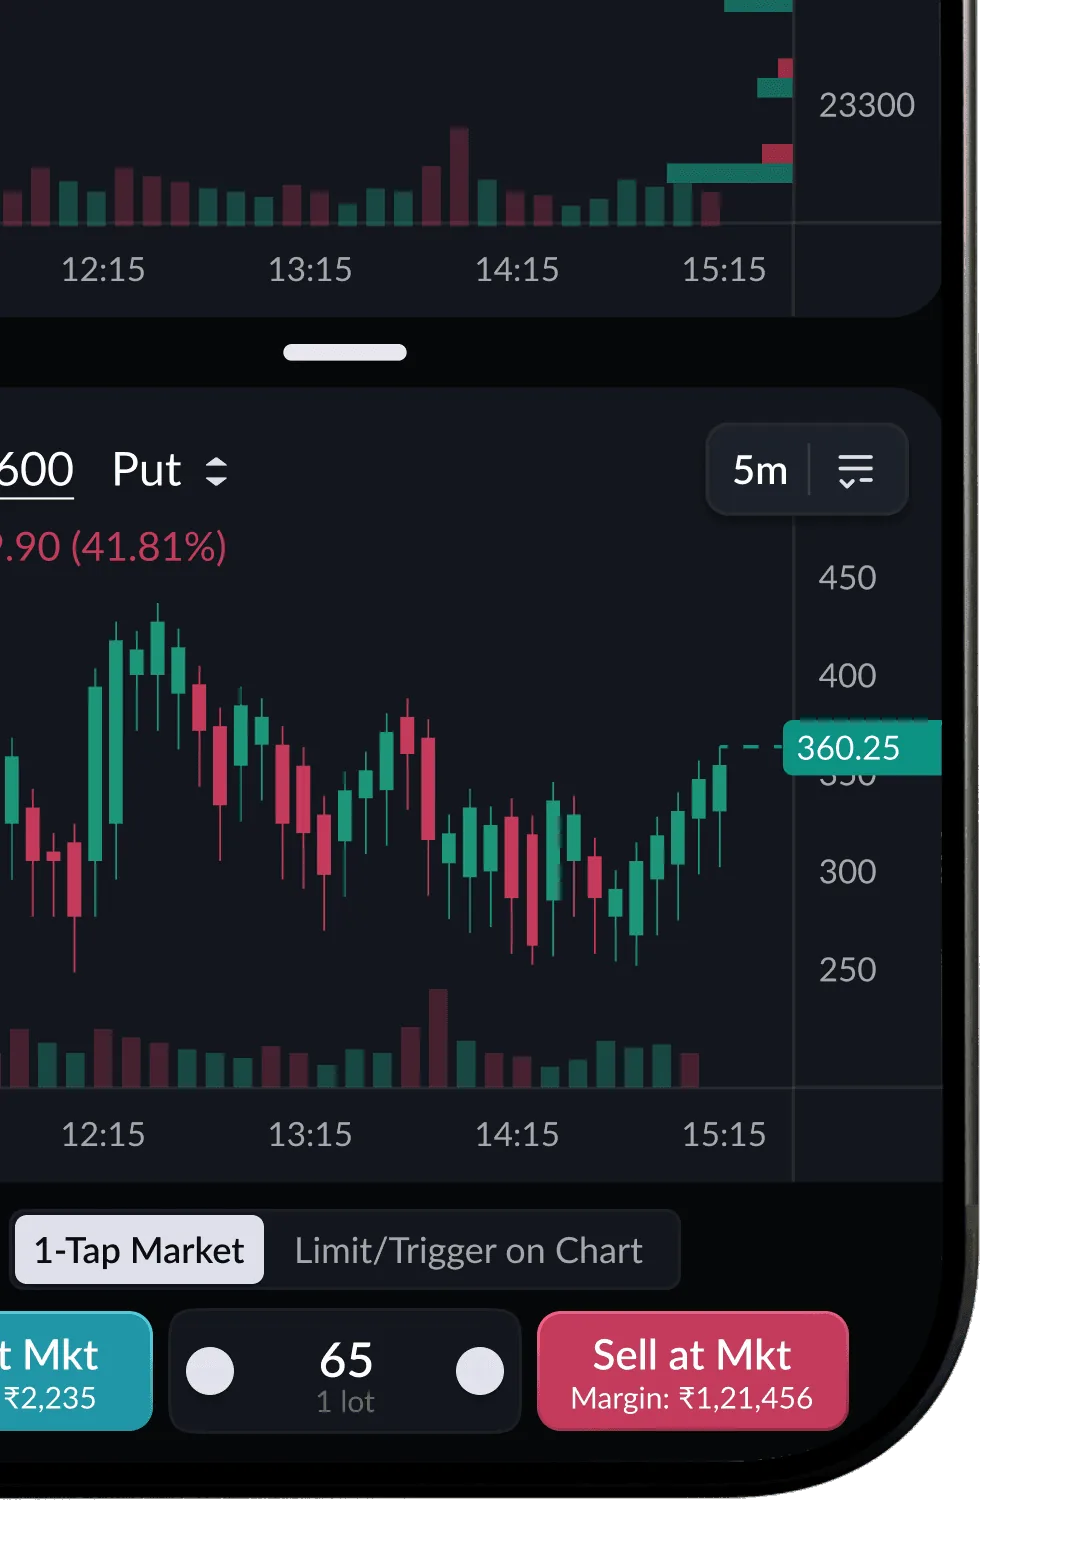
Execute market orders instantly or place limit and trigger orders directly from the chart, all with a single tap.
-
Instant access to necessities
Keep your P&L, positions, orders, funds, Super Alerts, Day Analysis, and Top Options in one place, giving you instant access to everything you need during market hours.
1-Tap order execution across devices
Whether you're placing a market order for instant execution or a limit order at your preferred price, trade seamlessly on desktop, tablet, and mobile.

Why Choose SAHI Scalper
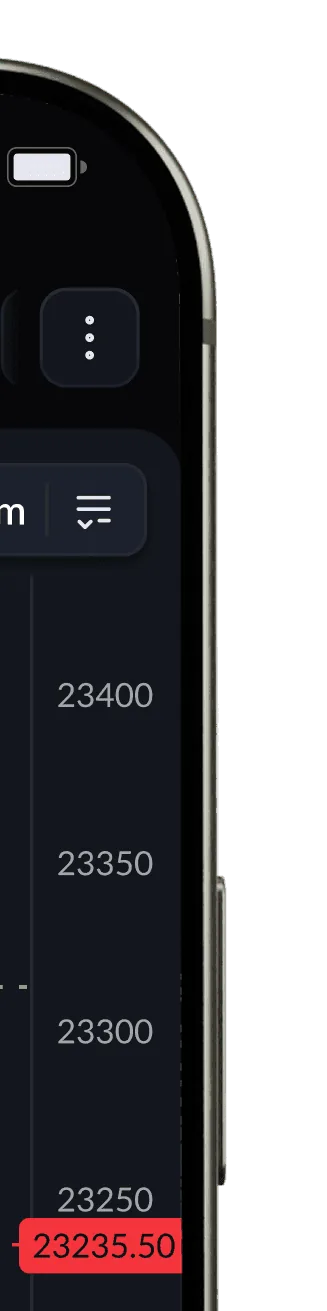
A complete suite of tools designed for active traders, bringing together lightning fast charting experience, real time market intelligence, exclusive indicators, alerts, drawing tools, and 1-Tap order execution.
-
In-house Charts for Traders,
by Traders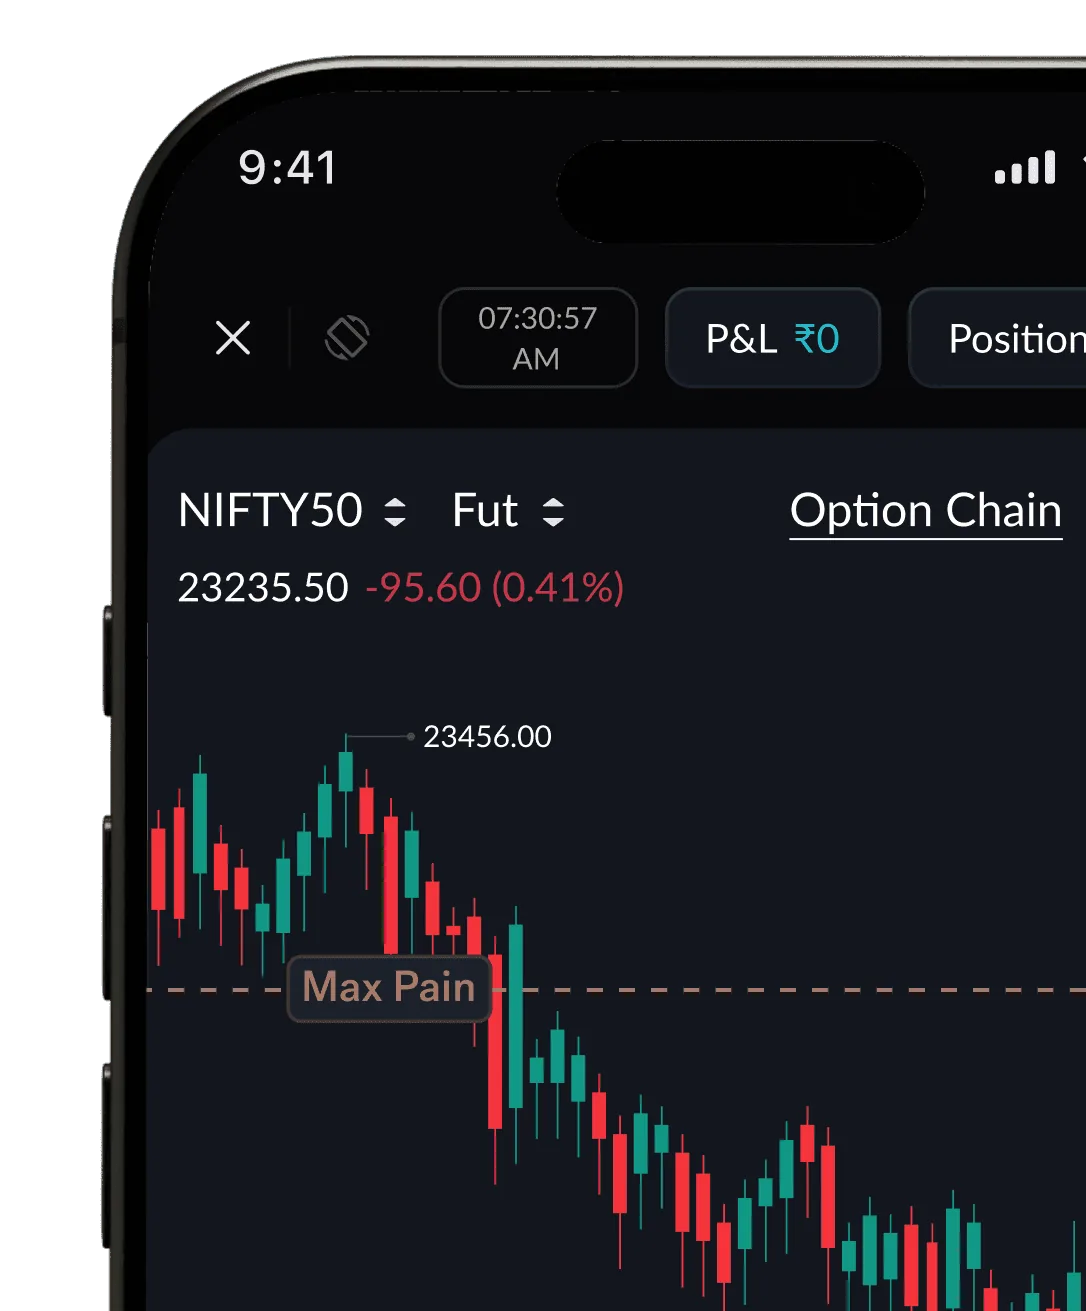
-
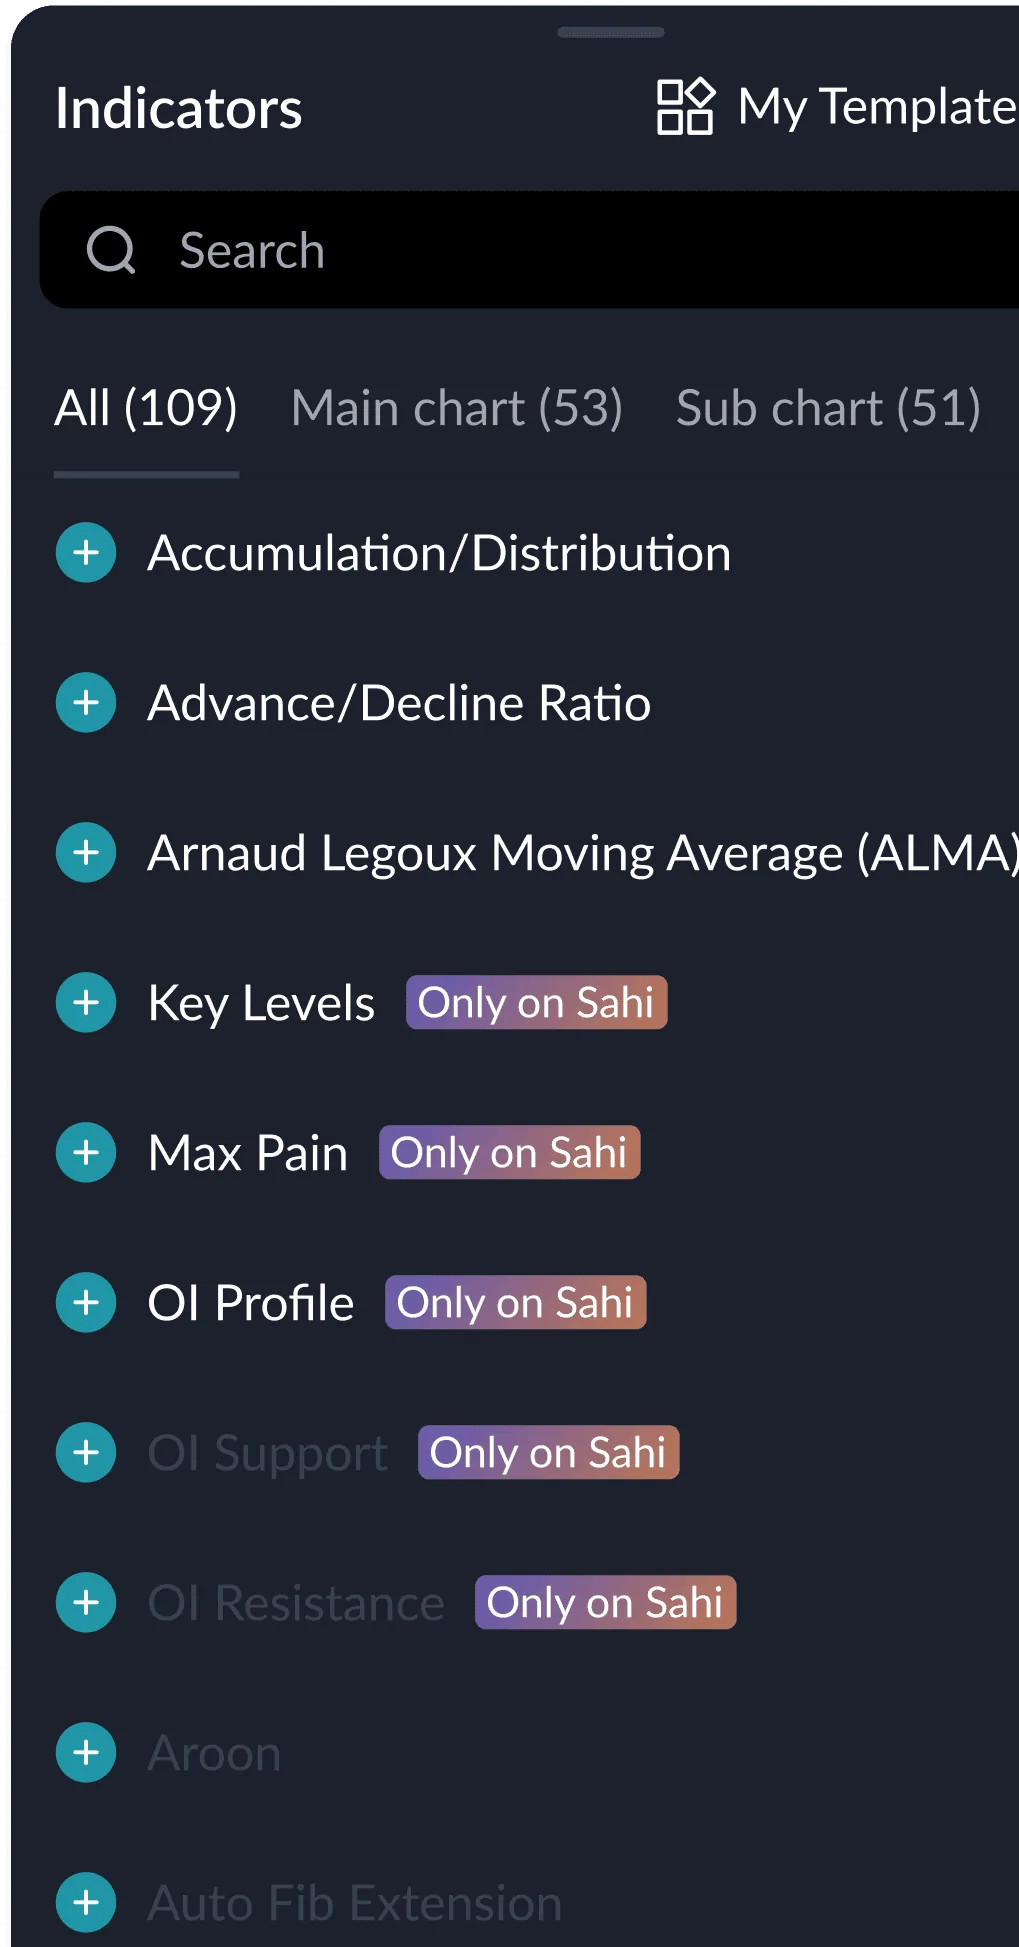
Exclusively Available on SAHI with
- Max Pain
- OI Profile
- OI Resistance
- OI Support
-
More than 100 indicators
-
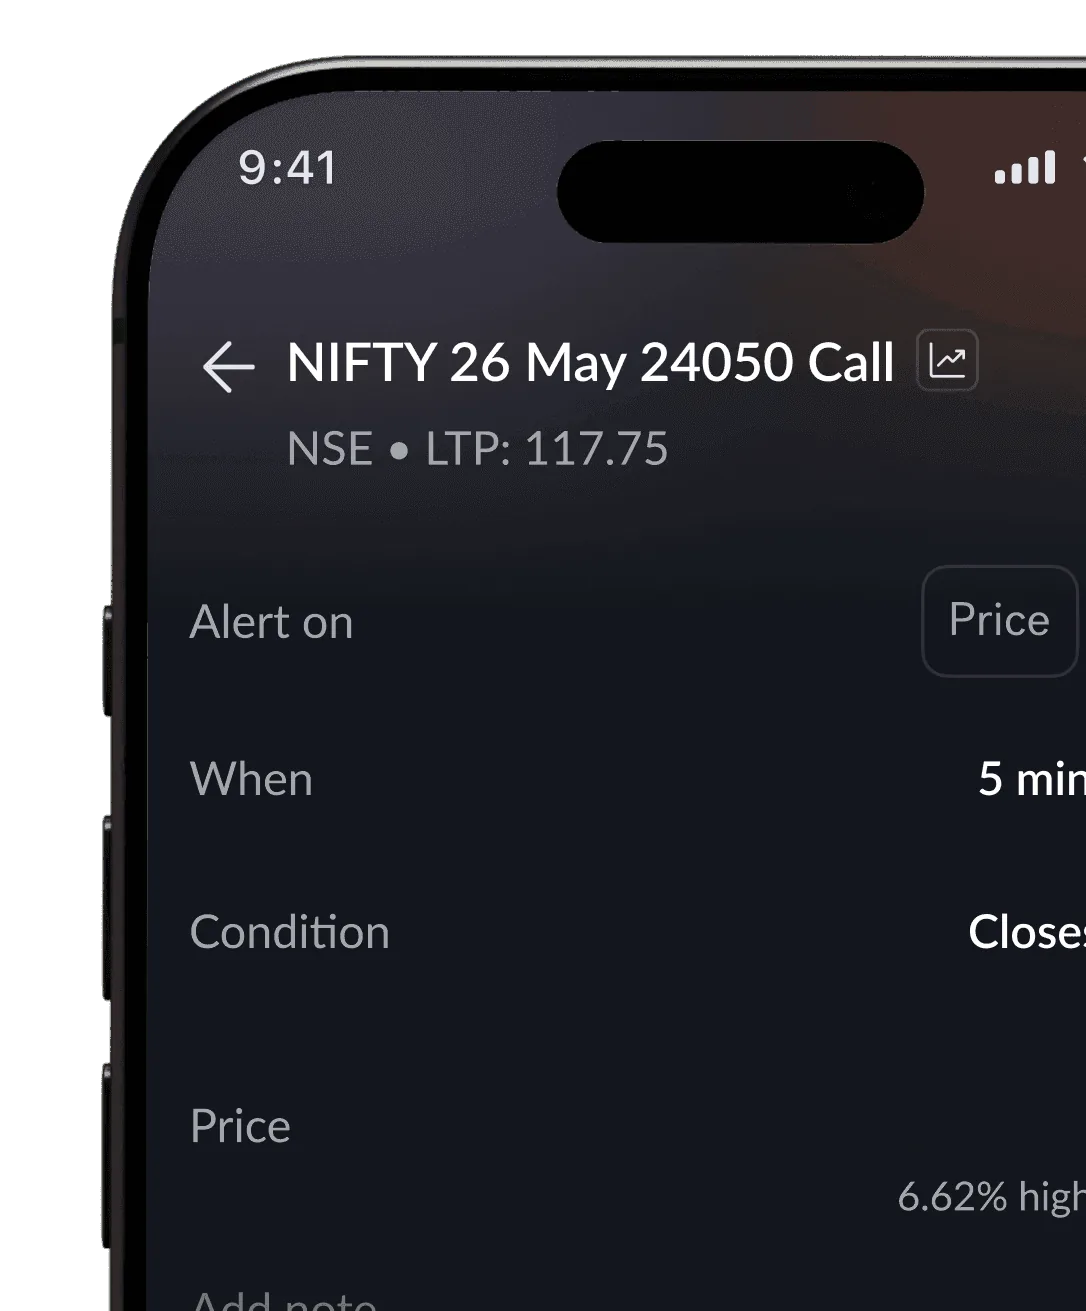
Super alerts for all market activities
-
Real time market insights
- Current Trend

- Market Direction

- Share Snapshot

- Current Trend
-
17+ Drawing tools
-
1-Tap Trade
Sync charts & positions


Upgrade your Scalping Experience
Learn faster with feature guides, market insights, and trading strategies curated for active traders.


SAHI Pulse
Picture-in-Picture mode keeps your live P&L and candle movements floating above other apps, so you can stay connected to the market while taking calls, browsing, or handling everyday tasks.
FAQs
Can I place orders directly from the chart?
Yes. SAHI Charts lets you buy, sell, and set stop loss and target straight from the chart without switching screens. Open positions appear as overlays showing entry price, live profit and loss, the stop-loss line, and the target line, and you can drag those levels to new prices while the chart updates.
What is Open Interest and how do I read it on a chart?
Open Interest (OI) is the number of outstanding option or futures contracts at a strike. Rising OI with rising price suggests fresh longs, while rising OI with falling price suggests fresh shorts. SAHI Charts plots OI directly on the chart so you can see where support and resistance are building.
What is the difference between Open Interest and volume?
Volume counts the contracts traded during a period, while Open Interest counts the contracts still open at a point in time. Volume can be high even when OI is flat if traders open and close within the day. Read together, they show both activity and commitment at a price level.
What are the best indicators for intraday trading?
Widely used intraday indicators include VWAP, moving averages, RSI, MACD, Supertrend, and Bollinger Bands. SAHI Charts offers 100+ indicators across trend, momentum, volatility, volume, and risk, including VWAP bands, Volume Profile, and RSI Divergence, so you can build a focused setup.
How many indicators should I use?
Most traders use three to five that do not overlap, for example one trend, one momentum, and one volume tool. Too many indicators tend to produce conflicting signals. SAHI Charts lets you save layouts so your chosen set loads the same way every session.
What is VWAP and how is it used?
VWAP, or Volume Weighted Average Price, is the average price weighted by volume through the day, used as an intraday fair-value line. Price above VWAP is often read as bullish and below it as bearish, and it commonly acts as intraday support or resistance. SAHI Charts includes VWAP and VWAP bands.
What is the best time frame for intraday charts?
Intraday traders commonly use 1-minute, 5-minute, and 15-minute charts, and scalpers go down to seconds. SAHI Charts supports seconds-level candles up to daily, and you can view multiple time frames together to confirm entries against the broader trend.
Do my chart drawings and indicators sync across mobile and web?
Yes. SAHI Charts syncs drawings, indicators, and layouts in real time across mobile and web, and drawings can be locked so they are not moved by accident. You can start your analysis on one device and continue on another without losing it.
High performance trading
at unmatched value
Pay only ₹10 per executed order and save 50% more than other platforms.
- ₹0Account opening
- ₹0AMC charges
- ₹10Brokerage charges per order